

OpenTelemetry Integration
OpenTelemetry integration adds automatic instrumentation to oRPC applications, enabling distributed tracing and performance monitoring with minimal setup.
WARNING
This guide assumes familiarity with OpenTelemetry. Review the official documentation if needed.
INFO
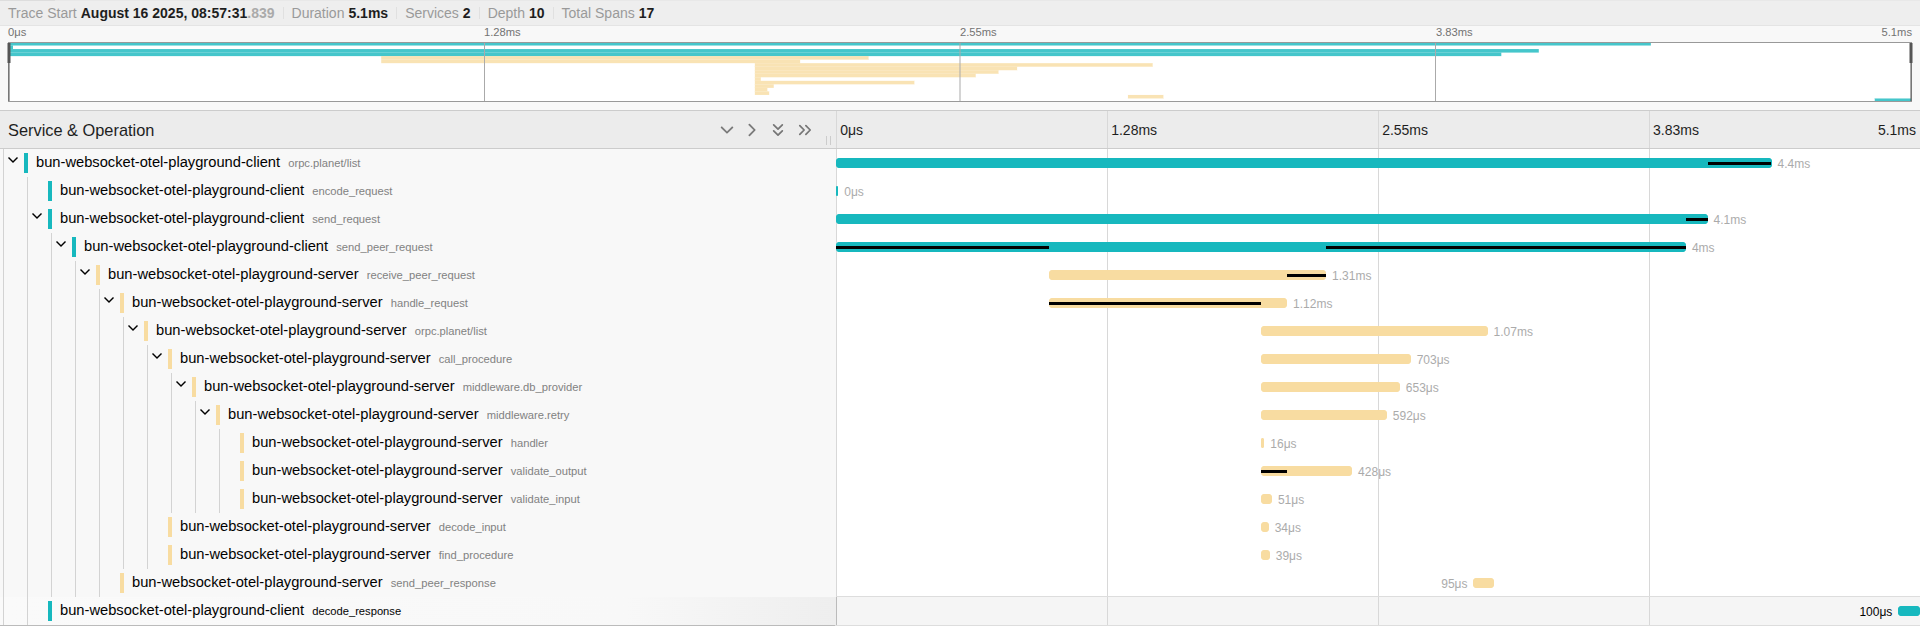
See the complete example in our Bun WebSocket + OpenTelemetry Playground.
Installation
npm install @orpc/opentelemetry@betayarn add @orpc/opentelemetry@betapnpm add @orpc/opentelemetry@betabun add @orpc/opentelemetry@betadeno add npm:@orpc/opentelemetry@betaSetup
To integrate OpenTelemetry with oRPC, use ORPCInstrumentation. It automatically instruments both client and server for distributed tracing.
import { NodeSDK } from '@opentelemetry/sdk-node'
import { ORPCInstrumentation } from '@orpc/opentelemetry'

const sdk = new NodeSDK({
  instrumentations: [
    new ORPCInstrumentation(),
  ],
})

sdk.start()import { WebTracerProvider } from '@opentelemetry/sdk-trace-web'
import { registerInstrumentations } from '@opentelemetry/instrumentation'
import { ORPCInstrumentation } from '@orpc/opentelemetry'
const provider = new WebTracerProvider()
provider.register()
registerInstrumentations({
instrumentations: [
new ORPCInstrumentation(),
],
})INFO
You can configure OpenTelemetry for your server, client, or both, depending on your needs.
Context Propagation
By default, ORPCInstrumentation enables context propagation between the client and server. You can disable it by setting propagationEnabled to false if you do not need it or if another instrumentation already handles it.
const instrumentation = new ORPCInstrumentation({
  propagationEnabled: false,
})
WARNING
Popular instrumentations that already handle context propagation include @hono/otel, @opentelemetry/instrumentation-http, and @opentelemetry/instrumentation-fetch.
Middleware Span
oRPC automatically creates spans for each middleware execution. You can access the active span to customize attributes, events, and other span data:
import { trace } from '@opentelemetry/api'

export const someMiddleware = os.middleware(async (ctx, next) => {
  const span = trace.getActiveSpan()

  span?.setAttribute('someAttribute', 'someValue')
  span?.addEvent('someEvent')

  return next()
})

Object.defineProperty(someMiddleware, 'name', {
  value: 'someName',
})
TIP
Define the name property on your middleware to improve span naming and make traces easier to read.
Capture Abort Signals
If your application heavily uses Event Iterator or similar streaming patterns, we recommend capturing an event when the signal is aborted to properly track and detach unexpected long-running operations:
import { trace } from '@opentelemetry/api'

const handler = new RPCHandler(router, {
  interceptors: [
    ({ request, next }) => {
      const span = trace.getActiveSpan()

      request.signal?.addEventListener('abort', () => {
        span?.addEvent('aborted', { reason: String(request.signal?.reason) })
      })

      return next()
    },
  ],
})